How to Use
A guide to searching HGVD v3.0 and using the genome browsers for GRCh37/hg19, GRCh38/hg38, and T2T-CHM13.
0. Which browser am I in?
HGVD v3.0 ships three coordinated genome browsers. Variant coordinates, tracks, and the underlying JBrowse versions differ between them, so several sections below split into separate hg19 and hg38/T2T instructions. The badges hg19 hg38 T2T mark which build a paragraph applies to (or all for shared behaviour).
| Build | JBrowse version | Variant tracks | eQTL tracks | Notes |
|---|---|---|---|---|
| GRCh37 / hg19 | Legacy HGVD viewer (custom, JBrowse v1-era) | Exome, WGS, Genotyping | Yes — cis & trans, genotype- and exome-based | Pre-existing interface, retained for backward compatibility. |
| GRCh38 / hg38 | JBrowse 2 | Exome, WGS, Genotyping (lifted from hg19 and re-validated) | Not yet available | Modern track UI; same coordinates as the public hg38 reference. |
| T2T / CHM13 | JBrowse 2 | Exome, WGS, Genotyping (lifted to T2T-CHM13) | Not yet available | Includes previously unresolved centromeric / acrocentric regions. |
1. Searching HGVD
From the top page you can reach the genome viewer through three complementary entry points. All three apply to all three builds: when results are displayed as a table, each hit carries per-build view links so you can switch reference assembly without re-searching.
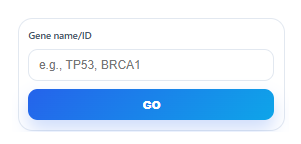
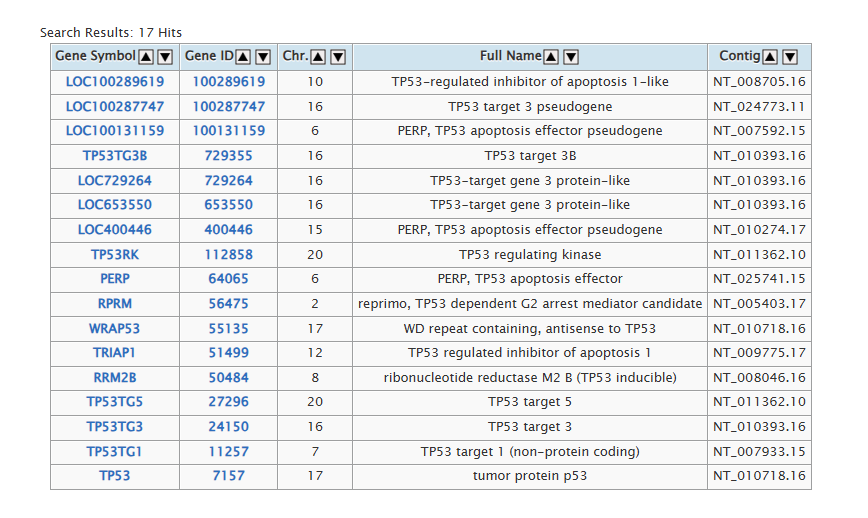
1-1. Keyword search all
- Enter a gene symbol or NCBI Gene ID in the
Gene name / IDbox on the top page and press GO. - The search-result table lists matching genes. Click the Gene Symbol to open the HGVD integrated viewer (you will be asked which build to open if you searched from the global top page). Click the Gene ID to jump to NCBI Gene for external annotation.
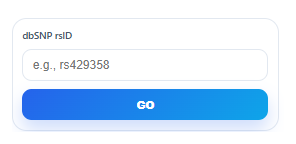
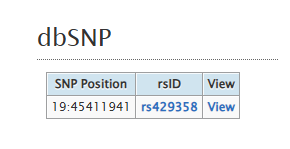
1-2. Search by rsID all
- Enter a dbSNP identifier (e.g.
rs1234567) in thedbSNP rsIDbox and press GO. - The result table shows the chromosomal position, the rsID, the summary of exome data, and a View link per build. Click View to open the integrated viewer at that position.
- Click the rsID column to open the corresponding NCBI dbSNP page.
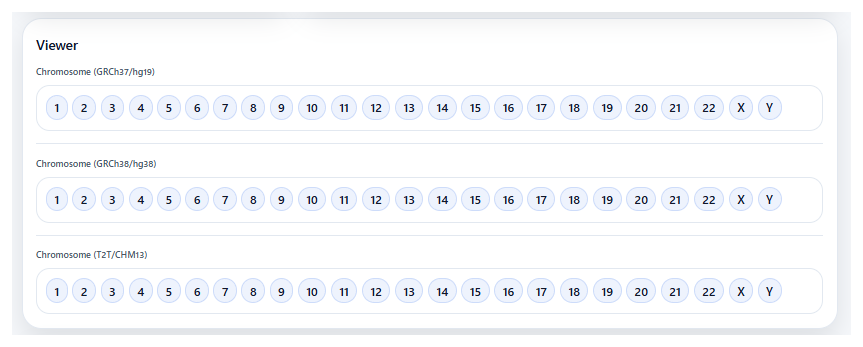
1-3. Search by chromosome all
The top page exposes three chromosome menus, one per build: GRCh37/hg19, GRCh38/hg38, and T2T/CHM13. Clicking a chromosome number opens the integrated viewer for that chromosome on the chosen build, which is convenient when you want to browse a region without first specifying a gene or marker.
2. HGVD genome integrated viewer
The integrated viewer presents the variant and annotation tracks for a region as a stacked layout. The exact toolbar and track-management controls depend on which build you are looking at, because the hg19 view uses the legacy HGVD viewer while the hg38 and T2T views are built on JBrowse 2. The two are described separately below.
2-1. Navigation hg19
The legacy viewer supports drag and toolbar navigation:
- Move: drag the main display left or right, or use the arrow buttons on the top toolbar.
- Zoom: use the magnifier buttons on the toolbar, or drag a region on the position bar — when you release the mouse the viewer zooms in to the selected region.
- Show / hide tracks: click the X on a track label to hide it; drag entries from the Available Tracks panel into the main display to show them again.
2-2. Navigation hg38 T2T
The hg38 and T2T browsers are JBrowse 2 instances and behave like other JBrowse 2 deployments:
- Move: click-and-drag the central panel, or use the arrow
buttons in the top toolbar; type a region (e.g.
chr1:148,500,000..148,520,000) into the location box. - Zoom: use the magnifier buttons in the toolbar, the slider, or shift-drag in the main panel to rubber-band a region.
- Tracks: open the Tracks menu from the linear-genome-view header to toggle individual tracks on and off. The full track list (variant, allele frequency, coverage, dbSNP, gene model) is available in this menu.
- Track configuration: click the wrench-style menu on a track header to change rendering options (e.g. switching frequency plots between dot-plot and pie-chart styles, choosing a colour scheme, or filtering by minimum coverage).
2-3. Data tracks all
The following tracks are shared across all three builds, though the rendering style may differ between the legacy hg19 viewer and the JBrowse 2-based hg38 / T2T viewers.
(1) Gene — Gene models with NCBI cross-references; click a gene body to open the NCBI Gene page. Gene models are colour-coded by gene type (protein-coding, pseudogene, miscellaneous RNA, other RNA, other, unknown).
(2) dbSNP — NCBI dbSNP variants. SNPs are rendered in yellow and insertion/deletion variants in pink; click a variant to open its dbSNP page.
(3) Exome — Exome variants of HGVD with category-based colouring: yellow = matches dbSNP; green = matches genotyping chip; blue = matches both dbSNP and chip; red = HGVD-unique. Allele frequencies are exposed on the dedicated frequency tracks (5).
(4) Genotyping — Variants observed in HGVD genotyping data.
(5) Frequency (Exome / WGS) — Allele frequency by base identity (A, C, G, T). At zoomed-out scales the track shows a dot plot of variant-allele frequency only; at higher zoom levels each site is displayed as a pie chart, with reference and variant alleles as sectors of the circle. Mouse-over a point to see the numeric frequencies; click (or double-click on hg19) to open a table of all variants currently visible in the viewer.
(6) # Samples Covered (Exome / WGS / Genotyping) — Bar chart showing, per site, how many samples were called vs. not called.
(7) Avg. Sample Read Depth (Exome / WGS) — Bar chart of the average per-sample read depth at each site.
(8) Frequency (Genotyping) — Equivalent allele-frequency display for the SNP-chip cohort: dot plot at low zoom, pie chart at high zoom.
(9) eQTL — cis & trans
hg19 only
The viewer displays separate cis-eQTL and trans-eQTL tracks for
both genotype-based and exome-based associations. Plotted values
are −log10(P); probes are drawn as coloured
squares along the top of the track, and the dots assigned to a
given probe share the colour of that probe. Use the pull-down menu
on the track label to switch the displayed p-value range
(P ≤ 1 × 10⁻⁵;
1 × 10⁻¹⁰ < P ≤ 1 × 10⁻⁵; or
P ≤ 1 × 10⁻¹⁰). Cis-eQTL probes within range of
a SNP are connected to that SNP with a line by default; trans
relations are not connected. Click a point or mouse-over for an
eQTL data table listing the SNP, position, p-value, gene, and probe.
3. pathSTR — repeat-expansion reference distributions
HGVD v3.0 includes a new pathSTR portal that reports long-read repeat-length and motif-composition distributions in unaffected controls (1000 Genomes Oxford Nanopore cohort, aligned to T2T-CHM13) at 87 medically relevant tandem-repeat loci. For each locus an interactive HTML report (generated by aSTRonaut) is provided. Use these distributions as an empirical baseline when judging whether a candidate patient allele is unusually long or unusually composed relative to the unaffected population.
To inspect a locus:
- Open pathSTR from the top navigation.
- Locate the gene of interest in the disease-grouped list (e.g. RFC1 under CANVAS, DMPK under DM1, HTT under HD).
- Click the gene to open its aSTRonaut report. Each report shows allele-length distributions and k-mer motif composition stratified by 1000 Genomes super-population.
Loci for which motif composition (not only length) is informative — most notably RFC1 — are reported with both a motif-aware k-mer breakdown and an alternative k-mer breakdown to highlight benign vs. pathogenic configurations.
4. Bulk downloads
Aggregate variant data and the new structural-variant release are available from the Download page:
- HGVD Release v3.00 (GRCh37/hg19) — SNVs and indels.
- HGVD Structural Variants v1.0 (GRCh37/hg19) — merged
population VCF formatted for ingestion by graph-construction
pipelines (e.g.
vg autoindex). - HGVD eQTL Release v8.1 — cis-eQTL summary (hg19 coordinates).
- HGVD Japanese Reference Sequence v1.0.
Citing HGVD. See the About page for citation instructions. If you publish results that depend on the pathSTR portal, please cite both HGVD and the underlying pathSTR / 1000 Genomes ONT publications (De Coster et al. 2024 and Gustafson et al. 2024).